Introduction to individual demand curve and market demand curve
In economics, the concepts of individual demand curve and market demand curve play a crucial role in determining the amount of goods consumers demand. These curves offer insightful information regarding consumer behavior and market dynamics. In this article, we will delve into the complexities of the individual demand curve and the market demand curve, examining their definitions, characteristics, and how they interact to determine the overall demand for a given good.
This article intends to provide a comprehensive understanding of these fundamental concepts via examples and illustrations. Therefore, let’s start this exciting journey into the world of demand curves.
I. Individual Demand Curve
Individual demand represents the quantity of a specific good that a consumer is willing to purchase at various price points. This curve conforms to the fundamental economic principle of the law of demand, which states that as the price of a good rises, the quantity demanded falls, and vice versa. The individual demand curve is sloping downwards from left to right, illustrating this inverse relationship.
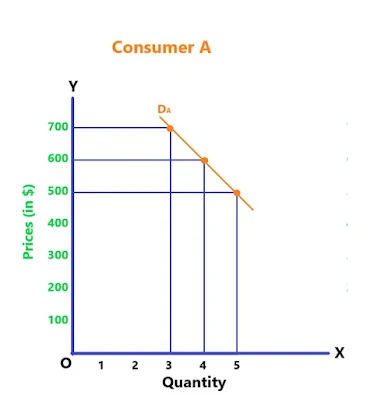
Consider a hypothetical scenario in which we analyze the demand for smartphones, for instance. Assume that Consumer A is willing to buy five smartphones at $500, four smartphones at $600, and three smartphones at $700. These data points can be plotted and connected to form Consumer A’s individual smartphone demand curve. The downward slope of the demand curve indicates a decline in quantity demanded as prices rise.
It is important to understand that individual consumer demand curves vary due to preferences, income levels, and other factors. Consequently, if we introduce Consumer B, we may observe a different individual demand curve based on their distinct purchasing behavior.
II. Market Demand Curve
Individual demand curves provide insight into the preferences of particular consumers, whereas the market demand curve is the sum of all individual demand curves for a given good. In essence, it represents the total quantity of that good that market consumers have demanded at various price points.
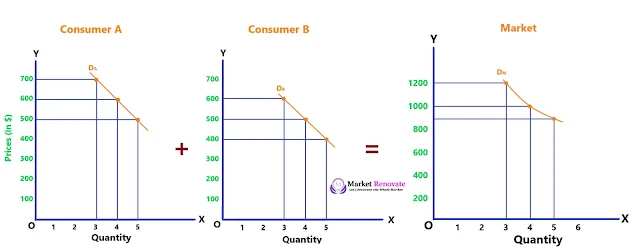
To further illustrate this concept, let’s continue with our smartphone illustration. Assume that there are two customers on the market: Consumer A and Consumer B. Individually, Consumer A is willing to purchase five smartphones for $500, four smartphones for $600, and three smartphones for $700. Consumer B’s individual demand curve, on the other hand, indicates that they intend to purchase five smartphones at $400, four smartphones at $500, and three smartphones at $600. For the smartphone market demand curve, we horizontally sum the quantities desired by both consumers at each price point.
By adding the quantities demanded by Consumers A and B, the smartphone market demand curve can be determined. This curve represents the total market demand for smartphones, taking into account the preferences and purchasing power of all consumers.
III. Interactions between Individual and Market Demand Curves
Individual and market demand curves are interdependent and crucial to understanding how markets operate. Individual demand curves reflect the preferences and behavior of consumers on a micro level, whereas market demand curves reveal the demand patterns and dynamics of an entire market.
As the sum of consumers’ individual demand curves forms the market demand curve, changes in consumer behavior can have a substantial effect on the overall demand for a given good. For example, if the price of smartphones decreases as a result of technological advancements or increased competition, consumers’ individual demand curves may shift upward, indicating greater quantities demanded at each price level. Consequently, the market demand curve would also experience a corresponding upward shift, representing an increase in demand for smartphones across the market.
Inversely, factors such as changes in consumer income, preferences, or the introduction of substitute goods can impact individual demand curves, thereby influencing the shape and position of the market demand curve. Understanding these dynamics is essential for businesses and policymakers navigating market conditions and making informed pricing, production, and resource allocation decisions.
Conclusion
Individual demand curves and market demand curves are essential components of economic analysis, providing useful insight into consumer behavior and market dynamics. Individual demand curves demonstrate the inverse relationship between price and quantity demanded, whereas market demand curves illustrate the aggregate demand of all consumers in a given market.


.jpeg)
0 Comments
If this article has helped you, please leave a comment.