Change in Market Equilibrium
Market prices are determined by the interaction between demand and supply and in competitive markets changes in market prices are due to a change in demand or (shift in the demand curve) or change in supply (shift in supply curve) or both. Equilibrium price does not move independently of the demand and supply situation. There are three causes of change in equilibrium which are as follows:Click here to learn about "Market Equilibrium."
Effect of Shift in Demand Curve
Whenever there is a shift in the demand curve, there is a change in the equilibrium point. The change in equilibrium point depends on the rightward and leftward shift in the demand curve. Therefore, the effect of change in demand or shift in demand curve can be again divided into two types as follows:
1. Effect of Rightward Shift in Demand Curve
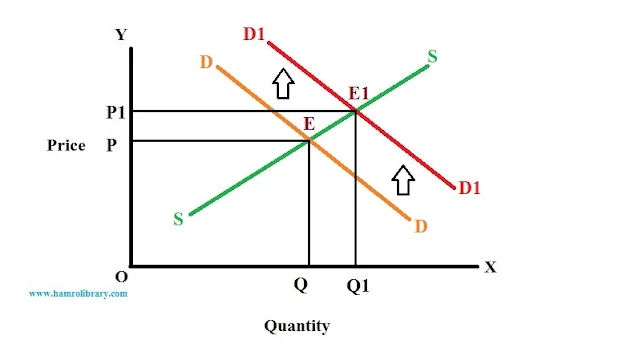
If the demand curve shifts towards the right remaining the supply curve constant, there will be an increase in both equilibrium price and output. The following figure shows the effect of a rightward shift in the demand curve or an increase in demand on equilibrium price and quantity of output.In the above figure, the X-axis represents quantity demanded and supplied and Y-axis represents a price. Let us suppose, the initial demand curve is given by the curve DD and the supply curve is given by the curve SS. The initial demand curve and supply curve are intersecting each other at point E. Point E is the initial equilibrium point. Hence, the initial equilibrium price is OP and the initial equilibrium quantity of output is OQ. Again, let us suppose, the initial demand curve shifts rightward from DD to D1D1, the supply curve remaining the same. The shift in the demand curve towards the right causes the equilibrium point to change from E to E1. Consequently, both equilibrium price and quantity of output increase. The new equilibrium price is OP1 and the new equilibrium quantity of output is OQ1.
2. Effect of Leftward Shift in Demand Curve
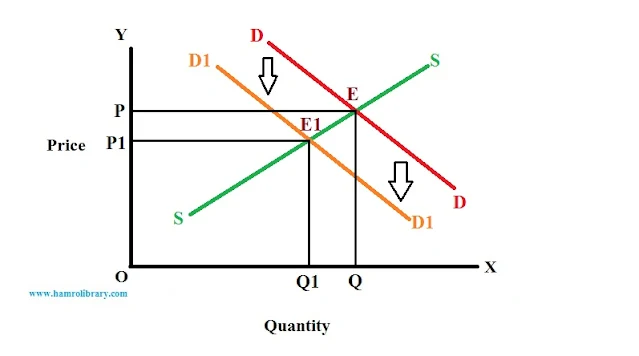
If the demand curve shifts towards the left, remaining the supply curve constant, there will be a decrease in both equilibrium price and quantity of output.The above figure shows the effect of a leftward shift in the demand curve on equilibrium price and quantity of output. DD is the initial demand curve and SS is the given supply curve. The initial demand curve and supply curve are intersecting at point E. Hence, point E is the initial equilibrium point. The initial equilibrium price is OP and the quantity of output is OQ. Let us suppose, initial demand curve DD shift leftward to D1D1 remaining the supply curve SS. When the initial demand curve DD shifts leftward to D1D1, the initial equilibrium point shifts to E1. Consequently, there is a decrease in equilibrium price and equilibrium quantity. The new equilibrium price is OP1, and the new equilibrium quantity is OQ1.
Effect of Shift in Supply Curve
Whenever there is a shift in the supply curve, there is a change in the equilibrium point. The change in equilibrium point depends on the rightward and leftward shift in the supply curve. The effect of the shift in supply curve on equilibrium point can be divided into two types as follows:1. Effect of Rightward Shift in Supply Curve
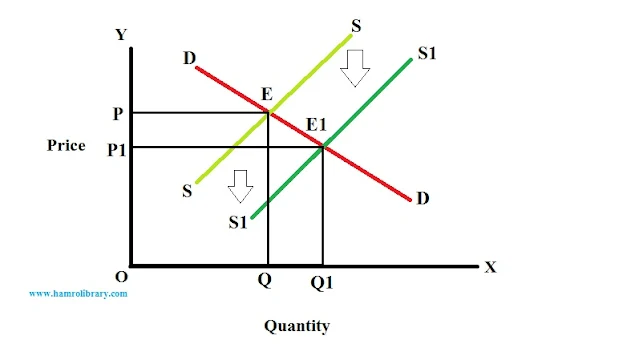
When the supply curve shifts rightward given the demand curve constant, the equilibrium price decreases but the equilibrium quantity of output increases. The following figure shows the effect of a rightward shift in the supply curve on equilibrium price and quantity of output.In the figure above, the upward sloping curve SS represents the initial supply curve given the demand curve DD. The initial supply curve SS and demand curve DD are intersecting at point E. Point E is the initial equilibrium point. Hence, the initial equilibrium price is OP, and the quantity of output is OQ. Let us suppose, the initial supply curve SS shifts rightward to S1S1; remaining the demand curve constant.
The demand curve DD and new supply curve S1S1 are intersecting at point E1. Point E1 is the new equilibrium point. Due to the shift in equilibrium point E to E1, there is a decrease in equilibrium price and an increase in the equilibrium quantity of output. The new equilibrium price is OP1, and the new equilibrium quantity of output is OQ1.
The demand curve DD and new supply curve S1S1 are intersecting at point E1. Point E1 is the new equilibrium point. Due to the shift in equilibrium point E to E1, there is a decrease in equilibrium price and an increase in the equilibrium quantity of output. The new equilibrium price is OP1, and the new equilibrium quantity of output is OQ1.
2. Effect of a leftward shift in the supply curve
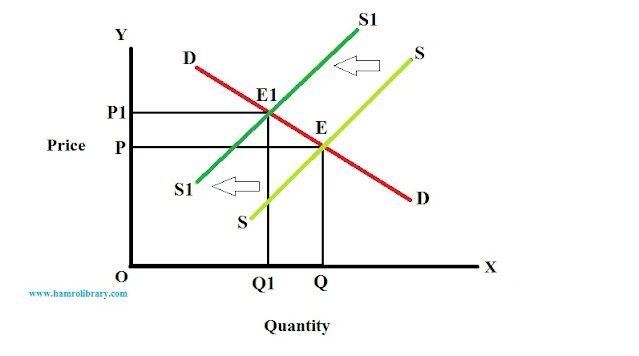
If the supply curve shifts leftward given the demand curve, there will be an increase in equilibrium price but a decrease in the equilibrium quantity of output. The following diagram shows the effect of a leftward shift in the supply curve in equilibrium price and quantity of output.In the figure above, SS is the initial supply curve given the demand curve DD. The initial supply curve SS and given demand curve DD are intersecting at point E. Point E is the equilibrium point. Hence, the initial equilibrium price is OP and the quantity is OQ.
Let us suppose, the initial supply curve shifts leftward from SS to S1S1, leaving the demand curve constant at DD. The new supply curve S1S1 and given demand curve DD are intersecting at point E1. Point E1 is the new equilibrium point. Due to shifting in equilibrium point, there is an increase in equilibrium price and a decrease in the equilibrium quantity of output. The new equilibrium price is OP1 and the new equilibrium quantity is OQ1.
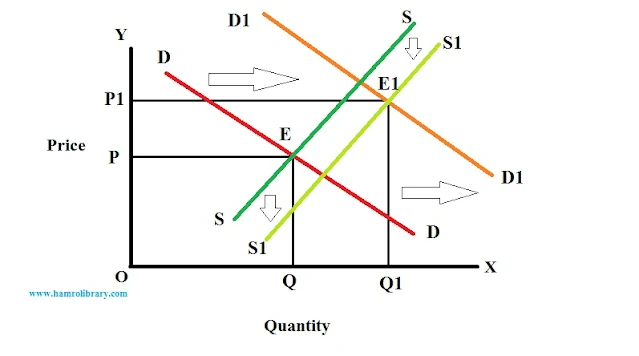
The effect of the simultaneous shift in demand and supply curve depends upon the extent of the shift in them, If relatives shift in demand and supply curves are equal and parallel, equilibrium price will remain the same but the quantity of output will change. It has been shown in the following figure:
Let us suppose, the initial supply curve shifts leftward from SS to S1S1, leaving the demand curve constant at DD. The new supply curve S1S1 and given demand curve DD are intersecting at point E1. Point E1 is the new equilibrium point. Due to shifting in equilibrium point, there is an increase in equilibrium price and a decrease in the equilibrium quantity of output. The new equilibrium price is OP1 and the new equilibrium quantity is OQ1.
Effect of Shift in Both Demand and Supply Curves (Simultaneous Shift in both Demand and Supply Curve)
The effect of the simultaneous shift in demand and supply curve depends upon the extent of the shift in them, If relatives shift in demand and supply curves are equal and parallel, equilibrium price will remain the same but the quantity of output will change. It has been shown in the following figure:
In the above figure, DD is the initial demand curve and SS is the initial supply curve. These two curves are intersecting each other at point E, which is the initial equilibrium point. Let us suppose, both these curves are shifting rightward from DD toD1D1 and SS to S1S1. The new demand curve D1D1 and new supply curves S1S1 are intersecting each other at point E1, which is the new equilibrium point. Since there is a relatively equal and parallel shift in both curves, the equilibrium price is the same, i.e. OP but equilibrium output has increased from OQ to OQ1.
If there is a relatively greater shift in the demand curve, both price and output will rise, On the other hand, if there is a relatively greater shift in the supply curve, the price will fall but the output will rise.
The figure below shows an increase in both equilibrium price and output due to a relatively greater shift in the demand curve:
The figure below shows a decrease in equilibrium price but an increase in the equilibrium quantity of output due to a relatively greater shift in the supply curve:



.jpeg)
0 Comments
If this article has helped you, please leave a comment.