Relationship between LAC and LMC:
Both LAC and LMC are derived from the long run total cost (LTC).i.e; LAC = LTC / Q & LMC = ∆LTC / ∆Q
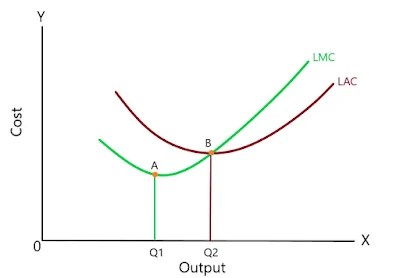
The relationship between LAC and LMC can be explained by the help of the following diagram:
In the above figure, LAC represents the long-run average cost curve and LMC represents the long run marginal cost curve. LMC cuts LAC from below and intersects at the minimum point of LAC. The relation between these two curves can be summarized in the following points:
- Both the curves are ‘U’ shaped.
- Both the curves intersect each other at point B. I.e. B=LMC=LAC
- Both the curves decline at the beginning, reach a minimum point and incline thereafter.
- Both the curves are flattened then SAC and SMC.
- When LAC is falling, LMC is below LAC.
- When LAC is rising, LMC is above LAC.
- LMC falls at a sharp rate than LAC and rises sharply than LAC.
- The minimum point of LMC lies below and to the left of the minimum point of LAC.


0 Comments
If this article has helped you, please leave a comment.