Derivation of short-run average cost curves
1. Average fixed cost (AFC)
The average fixed cost is obtained by dividing the total fixed cost by the level of outputs. It is also known as the per unit fixed cost of output.Symbolically;
AFC = TFC / Q
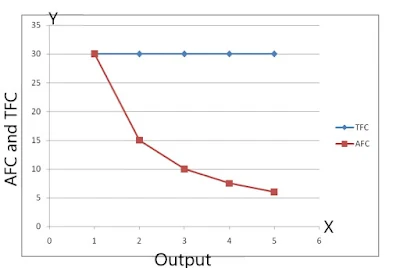
It can be explained by the help of following schedule and diagram:
Output (in units) | TFC (Rs) | AFC (Rs) |
1 | 30 | 30 |
2 | 30 | 15 |
3 | 30 | 10 |
4 | 30 | 7.5 |
5 | 30 | 6 |
In the above figure, we can see that the AFC curve is a rectangular hyperbola. AFC curve is downward sloping because, as we produce more units of output, AFC declines. It never touches the Y axis because, at zero units of production, AFC is infinite. Similarly, it never touches x-axis because AFC never becomes zero.
2. Average variable cost (AVC)
Average variable cost is obtained by dividing the total variable cost by the corresponding levels of output. It can be expressed as:AVC = TVC / Q
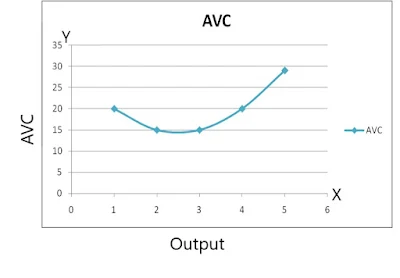
We can derive AVC by the help of following schedule and diagram:
Output (in units) | TVC (Rs) | AVC (Rs) |
1 | 20 | 20 |
2 | 30 | 15 |
3 | 45 | 15 |
4 | 80 | 20 |
5 | 145 | 29 |
In the above figure, we can see that AVC falls at the beginning and then inclines. An AVC curve is 'U' shaped because of the operation of the law of variable proportion.
3. Average Total Cost (ATC/ AC)
Average total cost is obtained by dividing the total cost by the corresponding level of output. It can be expressed as;ATC = TC / Q = ( TFC + TVC ) / Q = AFC + AVC
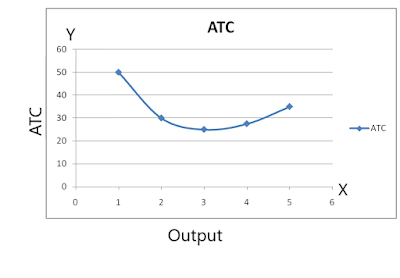
It can be derived with the help of following schedule and diagram:
Output (in units) | AFC (Rs) | AVC (Rs) | ATC (Rs) |
1 | 30 | 20 | 50 |
2 | 15 | 15 | 30 |
3 | 10 | 15 | 25 |
4 | 7.5 | 20 | 27.5 |
5 | 6 | 29 | 35 |
In the above diagram, we can see that ATC falls at the beginning. It becomes minimum and rises after that point. Therefore, it is 'U' shaped.


0 Comments
If this article has helped you, please leave a comment.